Q4 SaaS metrics (NDR, growth, efficiency) of 62 public SaaS companies
We keep close track of every SaaS IPO in the past five years (since MongoDB in October 2017). Those 62 companies have all now issued their Q4 2023 earnings reports. Below we summarize key financials and metrics.


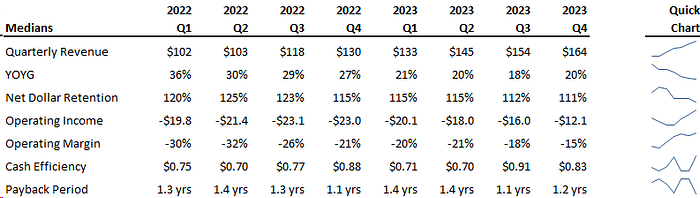
Median quarterly revenue of $164mm. Median and average revenue was $164mm and $242mm respectively. Annualized, that’s $656mm and $967mm respectively. These companies are quite large and note that revenue does include services which tends to be a small line item for most SaaS companies. Q3, 2023, Q2 2023, Q1 2023, Q4 2022, Q3 2022, Q2 2022, and Q1 2022 medians were $154mm, $145mm, $133mm, $130mm, $118mm, $103mm, and $102mm respectively.
YOY growth of 20%. Median and average YOY growth was 20% and 19% respectively. Given the size of these SaaS businesses, that is fantastic growth. The growth also seems to be stabilizing: Q3 2023, Q2 2023, Q1 2023, Q4 2022, Q3 2022, Q2 2022, and Q1 2022 medians were 18%, 20%, 21%, 27%, 29%, 30%, and 36% respectively, so growth is slowing.
Almost half generate an operating profit. 48% of the companies generate an operating profit. The median operating loss is -$12mm and average is -$11mm. Median and average margins are -15% and -11% respectively. Q3 2023, Q2 2023, Q1 2023, Q4 2022, Q3 2022, Q2 2022, and Q1 2022 medians were -18%, -20%, -20%, -21%, -26%, -32% and -30% respectively. Margins are improving!
Growing efficiently. Even though these companies generate a loss, they are adding new revenue at an efficient pace. On median the companies are adding $0.83 of new revenue for every dollar of loss. That means so long as net dollar retention is over 100%, the payback on median is 1.2 years. That’s very good . So long as your payback period on new revenue is inside of 2 years and you’re retaining the client forever (100%+ NDR), your investors should be happy to see you burn cash to grow ARR. We do not quote the average because it is subject to skew.
Revenue to loss ratio. The median revenue to loss ratio is 4.39x. In other words, for every dollar of loss, the companies have $4.39 of revenue. It’s a healthy ratio given the efficient growth, strong net dollar retention, and quick payback periods of the growth.
73% report their NDR. Of the 62 SaaS companies we follow, 45 of them report their net dollar retention in their quarterly filing. Only 6 report gross dollar retention, which we do not show because that data is subject to reporting bias (only companies with outstanding GDR are reporting, clearly).
Median NDR of 111%. Median net dollar retention for those companies reporting is 111% and the average is 109%. These are very strong retention metrics in SaaS. If you’re anywhere near that, you’re doing very well. It means the current customer base is a source of growth, growing 11%+ YOY even after accounting for downgrades and churn. Q3 2023, Q2 2023, Q1 2023, Q4 2022, Q3 2022, Q2 2022, and Q1 2022 medians were 112%, 115%, 115%, 115%, 123%, 125%, and 120% respectively.
Comparison to historical data. Below we compare Q3’s median to historical medians we have collected. Note the drop in growth.
Visit blossomstreetventures.com for more blogs and SaaS data. Thank you for your readership.